AY Honors/Weather - Advanced/Answer Key/es
| Climatología - Avanzado | ||
|---|---|---|
| Asociación General
|
Destreza: 2 Año de introducción: 1949 |
|
Requisitos
1
Para consejos e instrucciones, véase Climatología.
2
3
Cold Fronts
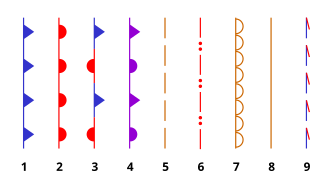
A cold front is defined as the leading edge of a cooler and drier mass of air. The air with greater density wedges under the less dense warmer air, lifting it, which can cause the formation a narrow line of showers and thunderstorms when enough moisture is present. This upward motion causes lowered pressure along the cold front. On weather maps, the surface position of the cold front is marked with the symbol of a blue line of triangles/spikes (pips) pointing in the direction of travel. Cold fronts can move up to twice as fast as warm fronts, and produce sharper changes in weather than warm fronts, since cold air is denser than warm air it rapidly replaces the warm air preceding the boundary. Cold fronts are typically accompanied by a narrow band of showers and thunderstorms. Cold fronts are usually associated with an area of low pressure, and sometimes, a warm front.
4
4a
4b
4c
4d
4e
4f
4g
4h
4i
5
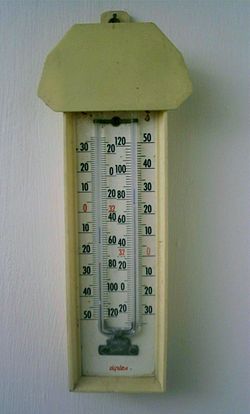
Registering Thermometer
Registering barograph
A barograph is a recording aneroid barometer, which measures barometric pressure. It produces a paper or foil chart called a barogram that records the barometric pressure over time.
Barographs use one or more aneroid cells acting through a gear or lever train to drive a recording arm that has at its extreme end either a scribe or a pen. A scribe records on smoked foil while a pen records on paper. The recording material is mounted on a cylindrical drum which is rotated slowly by clockwork. Commonly, the drum makes one revolution per day, per week, or per month and the rotation rate can often be selected by the user.
Hygrometer
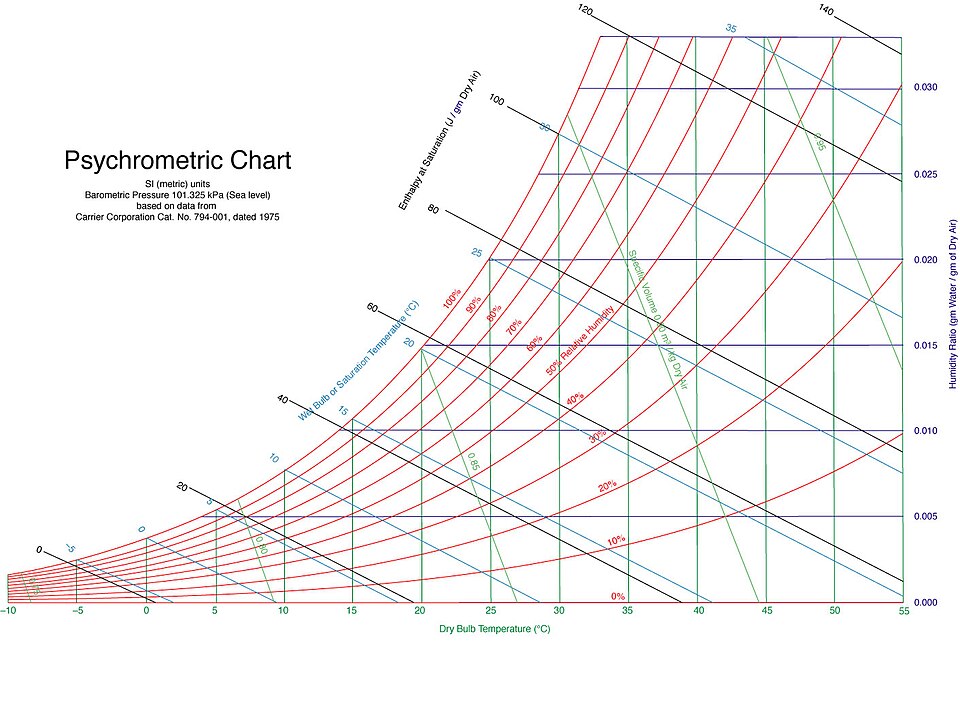
Hygrometers are instruments used for measuring humidity. A simple form of a hygrometer is specifically known as a "psychrometer" and consists of two thermometers, one of which includes a dry bulb and the other of which includes a bulb that is kept wet to measure wet-bulb temperature. Evaporation from the wet bulb lowers the temperature, so that the wet-bulb thermometer usually shows a lower temperature than that of the dry-bulb thermometer, which measures dry-bulb temperature. When the air temperature is below freezing, however, the wet bulb is covered with a thin coating of ice and yet may be warmer than the dry bulb. Relative humidity is computed from the ambient temperature as shown by the dry-bulb thermometer and the difference in temperatures as shown by the wet-bulb and dry-bulb thermometers. Relative humidity can also be determined by locating the intersection of the wet- and dry-bulb temperatures on a psychrometric chart (see below). One device that uses the wet/dry bulb method is the sling psychrometer, where the thermometers are attached to a handle or length of rope and spun around in the air for a few minutes.
Anemometer
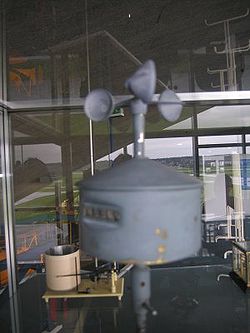
The simplest type of anemometer is the cup anemometer, invented (1846) by Dr. John Thomas Romney Robinson, of Armagh Observatory. It consisted of four hemispherical cups each mounted on one end of four horizontal arms, which in turn were mounted at equal angles to each other on a vertical shaft. The air flow past the cups in any horizontal direction turned the cups in a manner that was proportional to the wind speed. Therefore counting the turns of the cups over a set time period produced the average wind speed for a wide range of speeds.
The three cup anemometer developed by the Canadian John Patterson in 1926 and subsequent cup improvements by Brevoort & Joiner of the USA in 1935 led to a cupwheel design which was linear and had an error of less than 3% up to 60 mph. Patterson found that each cup produced maximum torque when it was at 45 degrees to the wind flow. The three cup anemometer also had a more constant torque and responded more quickly to gusts than the four cup anemometer.
6
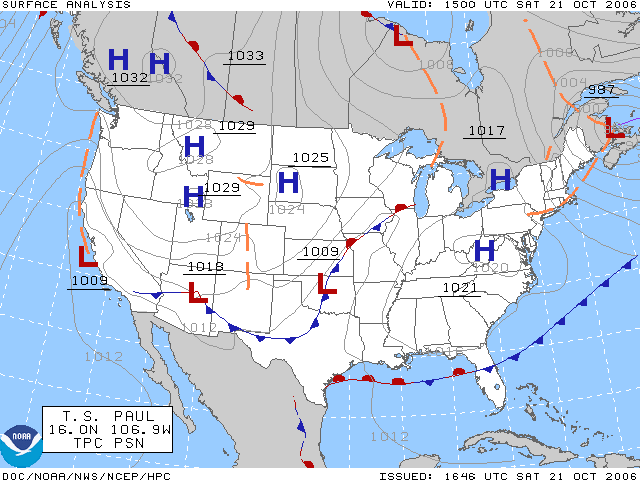
A weather map is a tool used to display information quickly showing the analysis of various meteorological quantities at various levels of the atmosphere. Maps utilizing isotherms show temperature gradients, which can help locate weather fronts. Isotach maps, analyzing lines of equal wind speed, on a constant pressure surface of 300 mb or 250 mb show where the jet stream is located. Two-dimensional streamlines based on wind speeds at various levels show areas of convergence and divergence in the wind field, which are helpful in determining the location of features within the wind pattern. A popular type of surface weather map is the surface weather analysis, which plots isobars to depict areas of high pressure and low pressure.
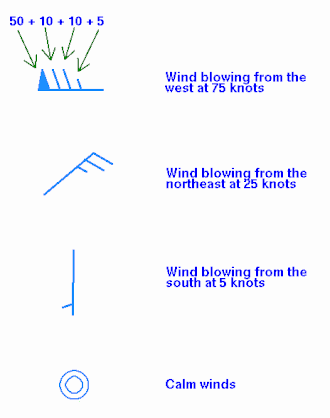
Winds have a standard notation when plotted on weather maps. More than a century ago, winds were plotted as arrows, with feathers on just one side depicting five knots of wind, while feathers on both sides depicted 10 knots (19 km/h) of wind. The notation changed to that of half of an arrow, with half of a wind barb indicating five knots, a full barb ten knots, and a pennant flag fifty knots.
An isobaric analysis involves the construction of lines of equal mean sea level pressure on a geographic map. The innermost closed lines indicate the positions of relative maxima and minima in the pressure field. The minima are called low pressure areas while the maxima are called high pressure areas. Highs are often shown as H's whereas lows are often shown as L's. Elongated areas of low pressure, or troughs, are sometimes plotted as thick, brown dashed lines down the trough axis.
7
The amount of water that air can hold depends on the temperature. The hotter it gets, the more water the air can hold. At any given temperature, the air can become so saturated with water that it cannot hold any more. Water will not evaporate under this condition.
The ratio of how much water is in the air compared to how much could be in the air is the relative humidity. The relative humidity is 100% when the air can hold no more water.
Recall that the air can hold more water when it is warm as compared to when it is cold. Therefore, if the temperature changes while the amount of water in the air remains constant, the humidity will change. As the air warms, the relative humidity will drop. As it cools, the relative humidity will rise.
The dew point is the temperature for which the relative humidity will be 100% assuming the amount of water in the air remains unchanged. If the temperature drops below the dew point, the air will no longer be able to hold all the water, so it condenses out in the form of dew or fog.
8
The Earth's atmosphere consists, from the top down, of the exosphere, thermosphere, mesosphere, stratosphere, and the troposphere.
Exosphere
The exosphere is the uppermost layer of the atmosphere. On Earth, its lower boundary at the edge of the thermosphere is estimated to be 500 km to 1000 km above the Earth's surface, and its upper boundary at about 10,000 km. It is only from the exosphere that atmospheric gases, atoms, and molecules can, to any appreciable extent, escape into space. The main gases within the exosphere are the lightest gases, mainly hydrogen, with some helium, carbon dioxide, and atomic oxygen near the exobase. The exosphere is the last layer before space.
Thermosphere
The thermosphere is the layer of the Earth's atmosphere directly above the mesosphere and directly below the exosphere. Within this layer, ultraviolet radiation causes ionization. It is the fourth atmospheric layer from earth.
The thermosphere begins about 80 km above the earth. At these high altitudes, the residual atmospheric gases sort into strata according to molecular mass. Thermospheric temperatures increase with altitude due to absorption of highly energetic solar radiation by the small amount of residual oxygen still present. Temperatures are highly dependent on solar activity, and can rise to 2,000°C. Radiation causes the air particles in this layer to become electrically charged, enabling radio waves to bounce off and be received beyond the horizon.
Mesosphere
The mesosphere is the layer of the Earth's atmosphere that is directly above the stratosphere and directly below the ionosphere. The mesosphere is located from about 50 km to 80-90 km altitude above Earth's surface. Within this layer, temperature decreases with increasing altitude. The main dynamical features in this region are atmospheric tides, internal atmospheric gravity waves (usually just called "gravity waves") and planetary waves. Most of these waves and tides are excited in the troposphere and lower stratosphere and propagate upward to the mesosphere. In the mesosphere, gravity-wave amplitudes can become so large that the waves become unstable and dissipate. This dissipation deposits momentum into the mesosphere and largely drives its global circulation.
Stratosphere
The stratosphere is the second layer of Earth's atmosphere, just above the troposphere, and below the mesosphere. It is stratified in temperature, with warmer layers higher up and cooler layers farther down. This is in contrast to the troposphere near the Earth's surface, which is cooler higher up and warmer farther down. The border of the troposphere and stratosphere, the tropopause, is marked by where this inversion begins, which in terms of atmospheric thermodynamics is the equilibrium level. The stratosphere is situated between about 10 km (6 miles) and 50 km (31 miles) altitude above the surface at moderate latitudes, while at the poles it starts at about 8 km (5 miles) altitude.
Troposphere
The troposphere is the lowest portion of Earth's atmosphere. It contains approximately 75% of the atmosphere's mass and almost all of its water vapor and aerosols.
The average depth of the troposphere is about 11 km in the middle latitudes. It is deeper in the tropical regions (up to 20 km) and shallower near the poles (about 7 km in summer, indistinct in winter).
9
This requirement is very similar to one found in the Explorer IA curriculum, except that Explorers are required to keep these records for two weeks and take readings twice a day. You can also combine these requirements with those in the Weather honor. If you forget to take records for a day, do not despair. As long as you have 21 readings, you can count this as three weeks.
9a
If you chose to make a rain gauge in the Weather honor, you can use that here. Otherwise, you can find official records online in many places, including The Weather Underground. Enter your zip code, and all the readings needed will be displayed (except for cloud formations).
You can download a tracking chart here and give one to each of your students. http://www.pathfindersonline.org/pdf/resources/weather_tracking_chart.pdf
9b
If you decide to build a barometer, you can use official readings to calibrate it.
9c
Note the cloud types (Cirrus, Stratus, Cumulus, or Nimbus).
9d
Unless you have a registering thermometer or a digital thermometer that records the daily extremes, this will have to come from official records.
9e
If you make your own anemometer, be aware that the reading will vary substantially throughout the day. Therefore, you should not be discouraged if your readings and the official readings to not agree.
9f
When you record the day's weather, jot down the forecast as well. The comparisons can be made the next day or at the end of the three week period.
10
Man has a greater impact on the climate than on the weather. The weather is the day-to-day conditions, while the climate covers long term averages. Man's production of greenhouse gases (such as carbon dioxide) has had and is having an effect on the global climate. These changes affect rainfall (increases in some areas, decreases in others) and the severity of storms.
Note too that the temperature in the city is invariably warmer than the temperature in the outlying areas. This is mostly because of pavement which readily absorbs heat during the day and then releases it during the night.
Dams create reservoirs which facilitate more evaporation than if the river were allowed to flow naturally. This increases both humidity as well as rainfall.
Referencias
- Categoría: Tiene imagen de insignia
- Adventist Youth Honors Answer Book/Honors/es
- Adventist Youth Honors Answer Book/es
- Adventist Youth Honors Answer Book/Skill Level 2/es
- Categoría: Libro de respuestas de especialidades JA/Especialidades introducidas en 1949
- Adventist Youth Honors Answer Book/General Conference/es
- Adventist Youth Honors Answer Book/Nature/es
- Adventist Youth Honors Answer Book/Nature/Primary/es
- Adventist Youth Honors Answer Book/Stage 0/es
- AY Honors/Prerequisite/Weather/es
- AY Honors/See Also/Weather/es
